

本記事はアフィリエイト広告(PR)を含みます
今後のためにグラフ描画用の関数をクラス化して他のプログラムに流用できるようにしておきたい。

1. ヘッダーファイル
ヘッダーファイルはこちら。
「classGnuplot」クラスとしてグラフ描画機能をまとめる。主な機能としては以下の通り。
- Gnuplotの起動/停止
- X軸、Y軸の描画範囲設定
- データセット
- グラフ描画
#include <iostream>
#include <vector>

using namespace std;

// データ用構造体
typedef struct {
	double x;
	double y;
}T_GNUPLOT_POINT;

class classGnuplot
{
public:
	// コンストラクタ
	classGnuplot() {
		m_vtPoint.clear();
		m_vtPoint.shrink_to_fit();
	};
	// デコンストラクタ
	~classGnuplot() {};
	// Gnuplot起動
	int Open_Gnuplot(string &strFile);
	// Gnuplot終了
	int  Close_Gnuplot(void);
	// X軸表示範囲設定
	void Set_XRange(double x1, double x2);
	// Y軸表示範囲設定
	void Set_YRange(double y1, double y2);
	// データセット
	void Set_Data(T_GNUPLOT_POINT &tPoint);
	// グラフ描画
	void Plot(int pause);
private:
	FILE *m_fp;
	int m_size;
	vector<T_GNUPLOT_POINT> m_vtPoint;
};
スポンサーリンク
2. Gnuplotの起動/停止メソッド
Gnuplot起動と停止のメソッドはこちら。
// Gnuplot起動
int classGnuplot::Open_Gnuplot(string &strFile) {
	if ((m_fp = _popen(strFile.c_str(), "w")) == NULL) {
		return -1;
	}
	return 1;
}

// Gnuplotの終了
int classGnuplot::Close_Gnuplot(void) {
	fprintf(m_fp, "exit\n");
	return 1;
}
スポンサーリンク
3. 描画範囲指定メソッド
X軸とY軸描画のメソッドはこちら。
// X軸表示範囲設定
void classGnuplot::Set_XRange(double x1, double x2) {
	char command[100];
	sprintf_s(command, 100, "set xrange [%lf:%lf]\n", x1, x2);
	fprintf(m_fp, command);
}

// Y軸表示範囲設定
void classGnuplot::Set_YRange(double y1, double y2) {
	char command[100];
	sprintf_s(command, 100, "set yrange [%lf:%lf]\n", y1, y2);
	fprintf(m_fp, command);
}
スポンサーリンク
4. データセットメソッド
データセットメソッドはこちら。
「T_GNUPLOT_POINT」構造体で入力されたx, yデータを内部変数に格納する。
// データセット
void classGnuplot::Set_Data(T_GNUPLOT_POINT &tPoint) {
	m_vtPoint.push_back(tPoint);
}
スポンサーリンク
5. グラフ描画メソッド
グラフ描画メソッドはこちら。
「plot \”-\” with lines」、「X, X」、「e」で任意の値をプロットすることができる。
また「with lines」をつけてラインで描画する。
// グラフ描画
void classGnuplot::Plot(int pause) {
	int i;
	fprintf(m_fp, "plot \"-\" with lines\n");
	for (i = 0; i < m_vtPoint.size(); i++) {
		fprintf(m_fp, "%lf, %lf\n", m_vtPoint[i].x, m_vtPoint[i].y);
	}
	fprintf(m_fp, "e\n");
	fflush(m_fp);
	if(pause == 1) system("pause");
}
6. 実装したクラスを使ってグラフを描画してみる
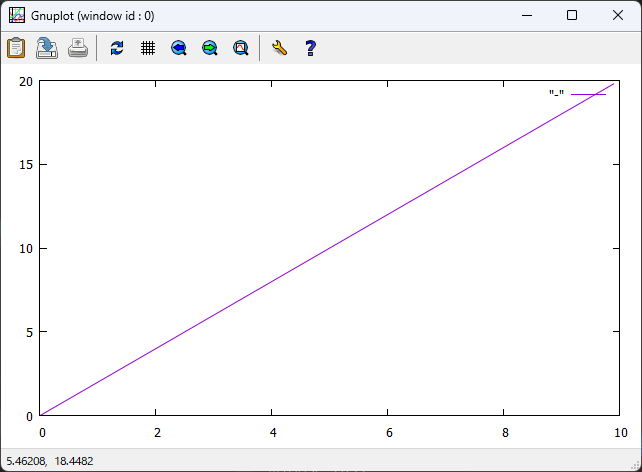
実際にグラフを描画してみる。今回はX軸0~10に0.1間隔、Y軸0~20の範囲に0.2間隔で描画するプログラムを作成した。ソースコードはこちら。
#include <iostream>
// クラスのヘッダーファイル
#include "Class_Gnuplot.h"

using namespace std;

int main() {
	int i;
	classGnuplot clGnuplot;
	T_GNUPLOT_POINT tData[100];
	string strFile = "Gnuplot\\gnuplot.exe";

	// データセット
	for (i = 0; i < 100; i++) {
		tData[i].x = i * 0.1;
		tData[i].y = i * 0.2;
		clGnuplot.Set_Data(tData[i]);
	}

	// Gnuplotを起動
	if (clGnuplot.Open_Gnuplot(strFile) > 0) {
		// X軸範囲0~10
		clGnuplot.Set_XRange(0.0, 10.0);
		// Y軸範囲0~20
		clGnuplot.Set_YRange(0.0, 20.0);
		// グラフ描画
		clGnuplot.Plot(1);
		// Gnuplotを閉じる
		clGnuplot.Close_Gnuplot();
	}
	else {
		cout << "Gnuplotの起動に失敗しました" << endl;
	}

	return 0;
}
結果はこのようになりました。
ちゃんと描画されていることが分かります。
今回は以上です。
7. 関連書籍
リンク
スポンサーリンク


コメント